Unveiling hidden allergenic hotspots: a fine-scale, parameter-optimized approach for spatiotemporal mapping of urban allergenicity assessments
Urban environments are complex mosaics of trees, streets, parks, and buildings that influence not only how we live and move, but also how exposed we are to environmental allergens. With rising pollen allergies worldwide and climate change altering flowering patterns and plant distributions, understanding where and when people are most at risk has become increasingly important. In the study “Unveiling hidden allergenic hotspots: A fine-scale, parameter-optimized approach for spatiotemporal mapping of urban allergenicity assessments” researchers developed a novel method to identify and map areas in cities that pose the greatest allergenic threat to residents.
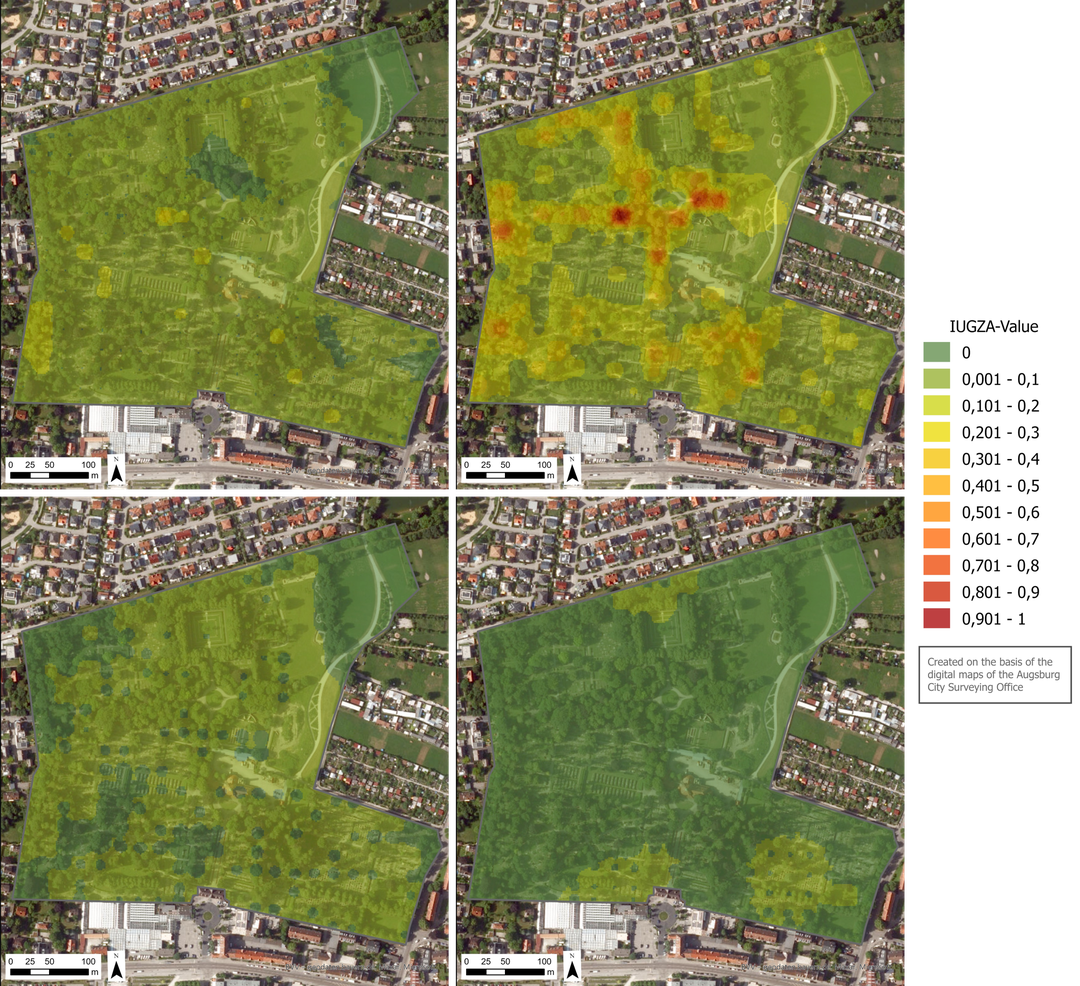
The research was carried out in Augsburg (southern Germany), where the team adapted an existing allergenicity index, originally designed to assess green spaces, to account for local tree species, flowering times, and environmental conditions. This modified Urban Green Zone Allergenicity Index (IUGZA) was then paired with detailed data on airborne pollen, temperature, and air pollution to create fine-scale maps of allergenic potential across the city. Instead of simply listing species or tree counts, the approach used spatial interpolation techniques in geographic information systems (GIS) to generate continous allergenicity heatmaps that show how allergenic risk varies from neighbourhood to neighbourhood. In addition pollen counts, temperature and air pollution data were used to determine a more realistic allergy risk.
?
?
Key Findings
- Spatial variability of allergenic potential: The analysis revealed that allergenicity is not evenly distributed across the urban landscape. Some neighbourhoods, particularly those with high densities of allergenic tree species such as Betula (birch) and Corylus (hazel), had substantially higher allergenic potential. Parks and green corridors could be hotspots if dominated by high-allergenic plants.
- Seasonal peaks align with flowering times: The researchers found clear seasonal patterns in allergenicity. Peaks in allergenic potential generally coincided with the flowering periods of dominant allergenic species in the area. This means that the risk to allergy sufferers changes throughout the year and is tightly linked to plant phenology, the timing of biological events like flowering.
- Role of temperature and pollution: Temperature emerged as a key factor influencing allergenic potential, reflecting its role in both pollen release and plant physiology. Air pollution, especially during warm conditions, added another layer, as certain pollutants can interact with pollen grains and potentially exacerbate allergic reactions.
- Spatiotemporal dynamics of potential exposure: By coupling phenological timing with environmental conditions, the study shows that potential allergenic exposure varies substantially across both space and time, suggesting that risk is highly localized and season-dependent within urban environments.
Why it matters
For public health, these insights are valuable because they link environmental conditions with allergy outcomes in real spaces where people live, work, and play. As cities grow and climates continue to change, tools like the allergenicity heatmaps developed in this study can help communities become more resilient and healthier places for all.
?
?